Accelerated progress in many countries of sub-Saharan Africa, but pockets of lagging performance in this year's MDG index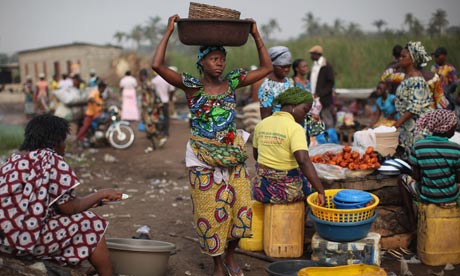
A market in Ganvie, near Cotonou, Benin, whose score on the MDG progress index has risen to 5.0, from 2.5 in 2010. Photograph: Dan Kitwood/Getty ImagesThirty sub-Saharan African countries appear to have accelerated progress towards meeting the millennium development goals (MDGs) over the past three years, according to analysis from anti-poverty group ONE, which aims to up-end perceptions of the region as wholly off track.Rwanda, Ethiopia, Malawi, Ghana and Uganda are among sub-SaharanAfrica's top performers in this year's MDG progress index, released on Wednesday as part of ONE's flagship Data report.The index, developed by ONE's global policy director Ben Leo while he was at the Center for Global Development thinktank, compares countries' observed progress on eight MDG indicators with estimates of what would be required for them to achieve the targets.Countries are allocated scores on each target (1 for on track, 0.5 for partially on track and 0 for off track), which are added to get a total score. A total score of 8.0 means a country is on track to meet all the targets in the index.
Accelerated progress in many countries of sub-Saharan Africa, but pockets of lagging performance in this year's MDG index
A market in Ganvie, near Cotonou, Benin, whose score on the MDG progress index has risen to 5.0, from 2.5 in 2010. Photograph: Dan Kitwood/Getty Images
Thirty sub-Saharan African countries appear to have accelerated progress towards meeting the millennium development goals (MDGs) over the past three years, according to analysis from anti-poverty group ONE, which aims to up-end perceptions of the region as wholly off track.
Rwanda, Ethiopia, Malawi, Ghana and Uganda are among sub-SaharanAfrica's top performers in this year's MDG progress index, released on Wednesday as part of ONE's flagship Data report.
The index, developed by ONE's global policy director Ben Leo while he was at the Center for Global Development thinktank, compares countries' observed progress on eight MDG indicators with estimates of what would be required for them to achieve the targets.
Countries are allocated scores on each target (1 for on track, 0.5 for partially on track and 0 for off track), which are added to get a total score. A total score of 8.0 means a country is on track to meet all the targets in the index.
Key findings from the 2013 index include:
• The Maldives has displaced Cambodia as the top-performing country, on track to meet all of the core MDG targets included in the index. Cambodia's score dropped from 8.0 last year to 7.0.• Some African countries have seen particularly sharp increases in their overall scores – Rwanda, for example, has moved from three to six, and is now tied with China.• Since 2010, 49 poor countries have improved their overall MDG scores, 17 have declined and 10 have stayed the same. This reflects "a general trend of accelerated progress, albeit with remaining pockets of lagging performance", says the report.• Thirty countries in sub-Saharan Africa appear to have accelerated progress in the past three years. At the same time some countries with very large populations, such as Nigeria and the Democratic Republic of Congo, are failing in many areas and slowing regional progress.
Leo said he designed the index to combat frustrating "broad brush portrayals" of MDG progress or lack thereof, with reports using regional aggregates and statements like "sub-Saharan Africa is woefully off track". This masks the achievements of individual countries, he says, whose stories need to be teased out to understand why some have seen greater gains than others – and identify where the greatest needs remain.For a study that relies heavily on country-level data, ONE's report is strikingly upfront about information gaps and its methodology section is replete with caveats. "Year-to-year volatility in country performance can be significant due to a variety of factors, such as data quality, budgetary cycles and exogenous shocks," it notes. "The time lag for the reporting of 'current' data – in some cases several years, or even a decade – also limits the accuracy of the results.""Simply put, it is difficult to definitively discern whether year-to-year differences are driven by concrete performance changes, measurement error (e.g. data noise) or some combination of the two."A high-level panel set up by UN secretary general Ban Ki-moon will report this week on its vision for what should succeed the MDGs.Leo says discussions around what should succeed the MDGs must hone in on the importance of increasing statistical capacity and getting baseline data. He hopes attention on a post-2015 development framework does not detract from efforts to meet current goals, however."We're not done; we have two and a half years and that's a lot of time to focus all available firepower … to achieve the maximum result," he said. "We're seeing tremendous progress – the trendlines are absolutely clear – so it would be really a missed opportunity if all the attention shifted."We've pulled out the total MDG progress index scores for countries covered in this year's edition. You can also download the full data below. What can you do with it?
• The Maldives has displaced Cambodia as the top-performing country, on track to meet all of the core MDG targets included in the index. Cambodia's score dropped from 8.0 last year to 7.0.• Some African countries have seen particularly sharp increases in their overall scores – Rwanda, for example, has moved from three to six, and is now tied with China.• Since 2010, 49 poor countries have improved their overall MDG scores, 17 have declined and 10 have stayed the same. This reflects "a general trend of accelerated progress, albeit with remaining pockets of lagging performance", says the report.• Thirty countries in sub-Saharan Africa appear to have accelerated progress in the past three years. At the same time some countries with very large populations, such as Nigeria and the Democratic Republic of Congo, are failing in many areas and slowing regional progress.
Leo said he designed the index to combat frustrating "broad brush portrayals" of MDG progress or lack thereof, with reports using regional aggregates and statements like "sub-Saharan Africa is woefully off track". This masks the achievements of individual countries, he says, whose stories need to be teased out to understand why some have seen greater gains than others – and identify where the greatest needs remain.
For a study that relies heavily on country-level data, ONE's report is strikingly upfront about information gaps and its methodology section is replete with caveats. "Year-to-year volatility in country performance can be significant due to a variety of factors, such as data quality, budgetary cycles and exogenous shocks," it notes. "The time lag for the reporting of 'current' data – in some cases several years, or even a decade – also limits the accuracy of the results."
"Simply put, it is difficult to definitively discern whether year-to-year differences are driven by concrete performance changes, measurement error (e.g. data noise) or some combination of the two."
A high-level panel set up by UN secretary general Ban Ki-moon will report this week on its vision for what should succeed the MDGs.
Leo says discussions around what should succeed the MDGs must hone in on the importance of increasing statistical capacity and getting baseline data. He hopes attention on a post-2015 development framework does not detract from efforts to meet current goals, however.
"We're not done; we have two and a half years and that's a lot of time to focus all available firepower … to achieve the maximum result," he said. "We're seeing tremendous progress – the trendlines are absolutely clear – so it would be really a missed opportunity if all the attention shifted."
We've pulled out the total MDG progress index scores for countries covered in this year's edition. You can also download the full data below. What can you do with it?
Data summary
2013 MDG progress index
Download the data
More data
World government data
Development and aid data
Can you do something with this data?
• Please post your visualisations and mash-ups on our Flickr group• Contact us at data@guardian.co.uk
• Please post your visualisations and mash-ups on our Flickr group
• Contact us at data@guardian.co.uk